Drug Use Statistics
Most of the data on this page is from the Australian Institute of Health and Welfare’s (AIHW) National Drug Strategy Household Survey (NDSHS). The AIHW classify the following as illicit drugs:
- illicit drugs (such as meth/amphetamines and cocaine);
- pharmaceuticals used for non-medical purposes (for example, using oxycodone or benzodiazepines without a prescription, or in a quantity or for a purpose for which it is not intended); and
- volatile substances used inappropriately (for example, inhalants such as petrol or glue).
Unless stated, all data on this page is Western Australia specific.
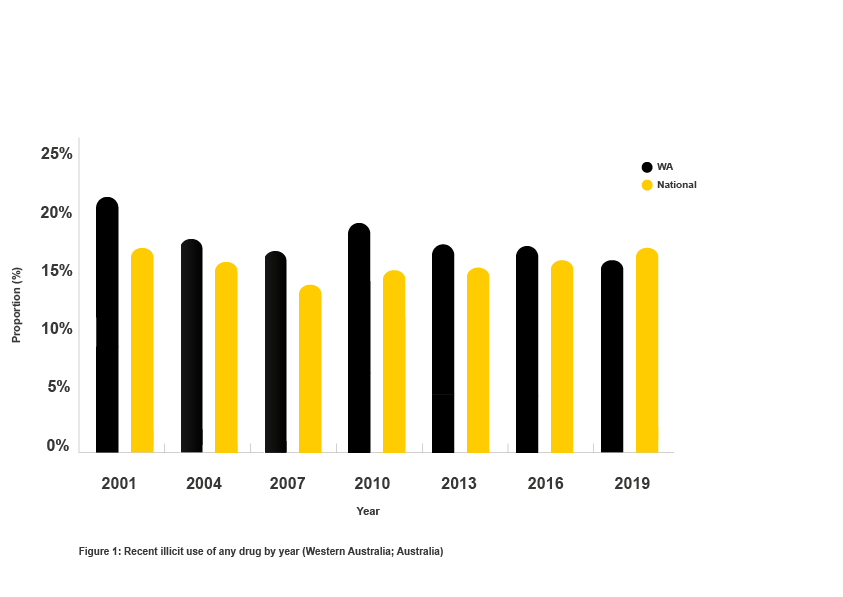
Lowest proportion of Western Australians using illicit drugs since 2001
In 2019 the NDSHS reported that around one in six (15.6%) Western Australian’s aged 14 years and older reported using illicit drugs in the previous 12 months1 (13.2% excluding pharmaceuticals).2 This is the lowest proportion recorded by the NDSHS since 2001 (21.7%), and lower than the 2019 national average of 16.4 percent (Figure 1).1
Males were more likely to have recently* used illicit drugs in comparison to females (18.1% and 12.9% respectively).3
Western Australian data shows that only 22% of young people aged 15-24 years reported using illicit drugs in the last 12 months (2019). That means 4 out of 5 young people do not use illicit drugs4. You can find out more about young people and drug use here.
The average age of initiation of illicit drug use (excluding pharmaceuticals) in 2019 was 18.7 years old. In comparison, the average age for first use of alcohol was 17.2 years, and 16.5 years of age for tobacco.5
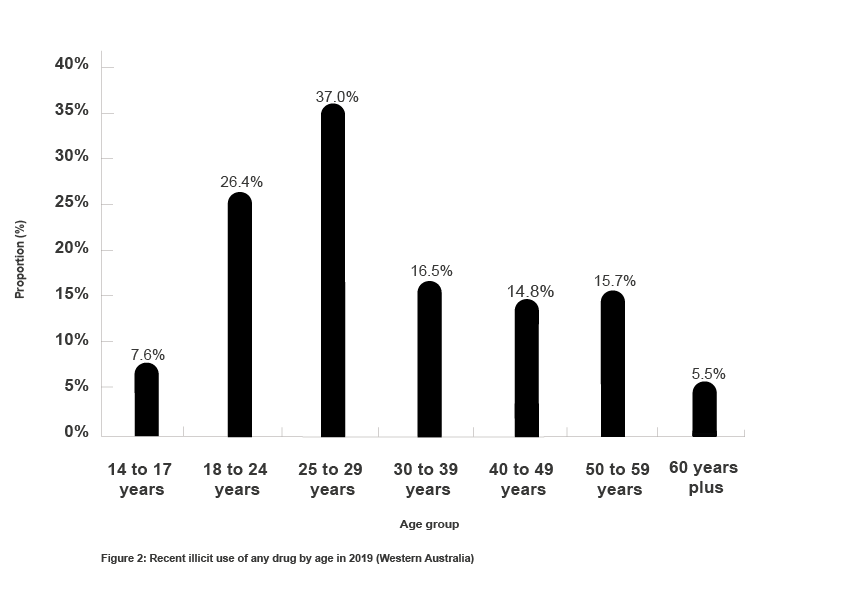
In 2019, the age group with the highest reported illicit drug use was those aged between 25-29 years, of which 37 percent reported use in the last 12 months (Figure 2). When looking at Australia wide data it was the 18-24 year age group reporting the highest proportion of use (31.2%) in comparison to 28.9% for the 25-29 age group.6
In contrast to 2007, 2019 recent illicit drug use has decreased significantly among 14-17, and 18-24 year olds, and has remained relatively stable among 25-29, 30-39, and 40-49 year olds, but has increased significantly among 50-59 year olds.6
Downward trend of illicit drug use among Western Australian school students (12 to 17 years)
In 2017, less than one in five Western Australian school students (18.4%) had ever used at least one illicit drug (Figure 3). This is a significant decrease since 1996 (40.7%).7 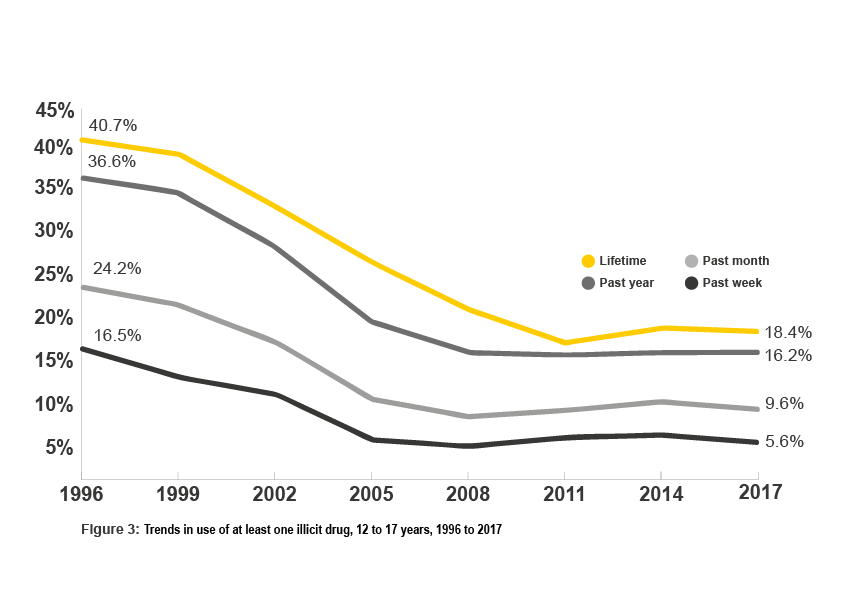
Between 1996 and 2017, there was also a significant decrease in the number of students who had used illicit drugs in the...
- past year (36.6% to 16.2%)
- past month (24.2% to 9.6%), and
- past week (16.5% to 5.6%).7
Cannabis, the most commonly used illicit drug
In 2019, approximately one in 10 (11.2%) Western Australians had recently used cannabis.2
People living in Western Australia reported higher rates of methamphetamine use (2.1%) than the national average of 1.3%; however, 2019 usage has halved from 2007 levels (4.2%). Western Australians reported lower use of cannabis, ecstasy, cocaine, hallucinogens, inhalants, and ketamine than the national average.2
As shown in Figure 4, the proportion of recent illicit drug use by Western Australians reduced for most drug types in 2019 in comparison to 2016; however recent use did increase for cocaine from 1.6 percent and 2.4 percent respectively.2
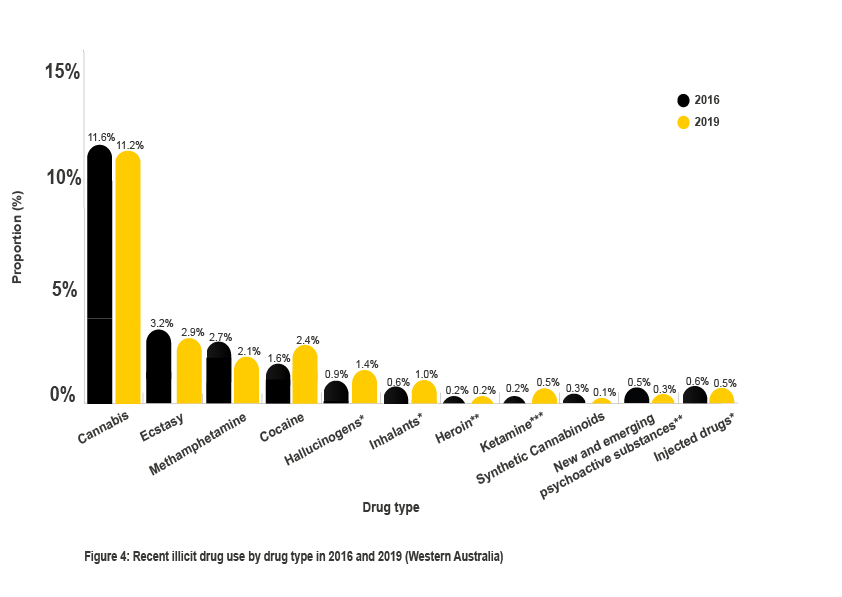
Caution must be used when interpreting the data for the drug types with an astrix. The estimate may have a relative standard error*, a high level of sampling error** or both***. This is generally due to small sample sizes.
The cost of illicit drug use
Alcohol and other drug use cost the Australian community an estimated $55.2 billion per year, of which 27.3 percent is attributed to alcohol and 14.6 percent is attributed to illicit drug use.8
For more information on trends by drug type download the AIHW NDSHS 2019 or for state specific data, use the supplementary data tables.
*Use in the past 12 months
#14-21 year olds
References
1. Australian Institute of Health and Welfare, National Drug Strategy Household Survey 2019; data table S.23, in Drug Statistics series 2020: Canberra
2. Australian Institute of Health and Welfare, National Drug Strategy Household Survey 2019; data table S.29, in Drug Statistics series 2020: Canberra
3. Australian Institute of Health and Welfare, National Drug Strategy Household Survey 2019; data table S.25, in Drug Statistics series 2020: Canberra
4. Australian Institute of Health and Welfare, National Drug Strategy Household Survey 2019; data table S.28, in Drug Statistics series 2020: Canberra.
5. Australian Institute of Health and Welfare, National Drug Strategy Household Survey 2019; data table S.31, in Drug Statistics series 2020: Canberra
6. Australian Institute of Health and Welfare, National Drug Strategy Household Survey 2019; data table S.28, in Drug Statistics series 2020: Canberra
7. Guerin, N., & White, V. (2018). ASSAD 2017 Statistics & Trends: Australian Secondary Students’ Use of Tobacco, Alcohol, Over-the-counter Drugs, and Illicit Substances. Retrieved from https://www.researchgate.net/project/Australian-Secondary-Students-Alcohol-and-Drug-Survey-ASSAD
8. Collins DJ and Lapsley HM, The costs of tobacco, alcohol and illicit drug abuse to Australian society in 2004/05. 2008.(pg. xi)
Page last updated: 25 November 2020